PhD Research Work
A noninvasive neuromodulation technique using Low-Intensity Focused Ultrasound (LIFU)
to treat alcohol use disorder (AUD).
The following sections describes different parts of the project that I already completed or currently
working on:
-
 Photoacoustic Imaging of alcohol-induced changes and identification of affected neural circuits
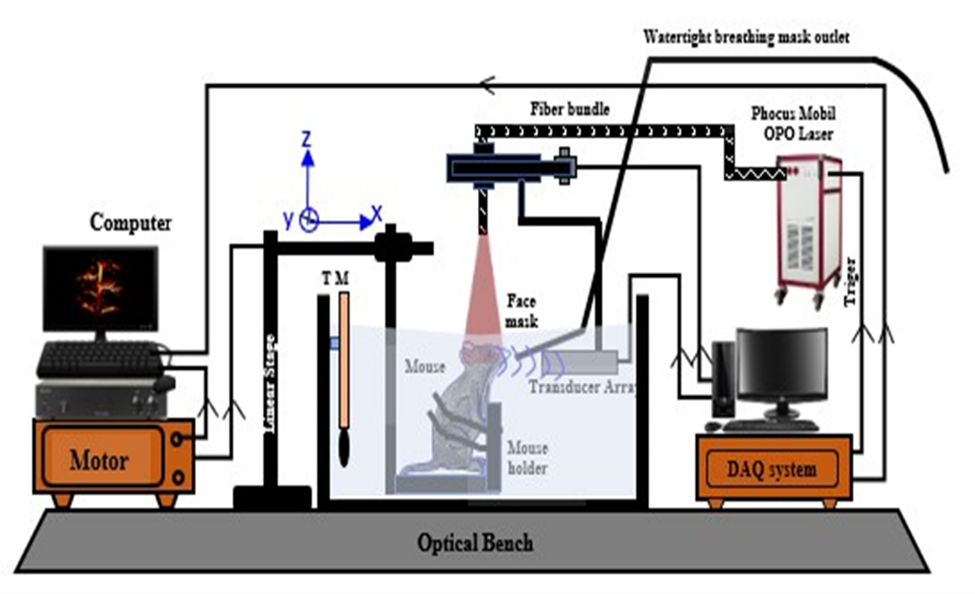
A 2D multispectral photoacoustic imaging system shown in Figure 1, was used to analyze the changes in cerebral vessel diameter and hemoglobin oxygen saturation in High and Low Alcohol Preferring (LAP) mice. Evaluation of these two major parameters helped to understand the alcohol-induced changes in the mouse brain as well as in identifying the neural circuits for targeted modulation.
Fig 1: Photoacoustic imaging system for non-invasive in vivo imaging of the cerebral vasculature in alcohol preferring mice. TM-Thermoelectric thermometer with water heater, TLS-Translational linear stage. -
 PAT Imaging of Alcohol-Induced Changes in Cerebral Vessel Diameter
A significant difference in optical absorption between hemoglobin, deoxyhemoglobin, and surrounding tissues was observed in HAP and LAP mice, resulting in good contrast and enabling the clear identification of cerebral blood vessels in the PAT images. First, a normalized Gaussian curve was fitted and then its full width half maximum (FWHM) was calculated to extract and calculate the blood vessel diameters.
Fig 2: Estimation and comparison of selected blood vessels between HAP and LAP. A, Details of a Normalized Gaussian fit for one of the vessels of interest from which full width at half maximum (FWHM) is estimated (ICV- Inferior cerebral vein, MCA- Middle cerebral artery, Acer: -Anterior Cerebral Artery). B, Results of statistical analysis and comparison between selected vessels for 5 HAP and 5 LAP (3 x 5 vessels for each animal model). C(i) and C(ii), Typical PAT image of HAP and LAP mouse cerebral cortex respectively at 800nm wavelength.
The results demonstrates that vessel diameter is statistically and significantly larger in low alcohol preferring mice, compared to their high alcohol preferring counterparts. -
 PAT Imaging of Alcohol-Induced Changes in Hemoglobin Oxygen Saturation
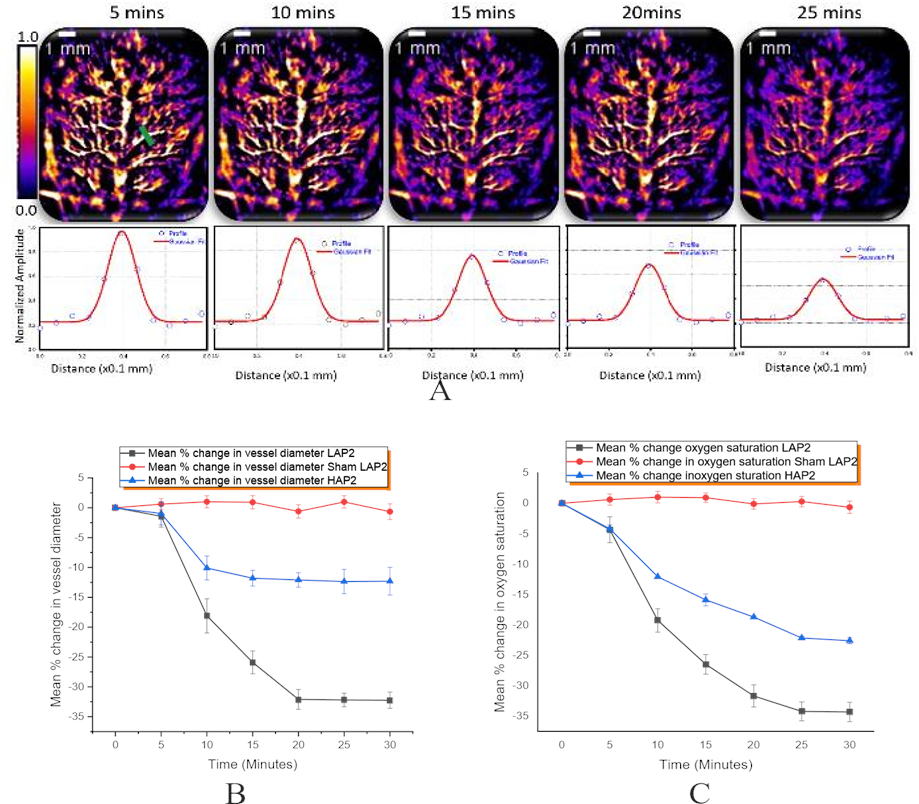
To evaluate the changes in hemoglobin oxygen saturation, photoacoustic signals were collected at 720nm and 840nm wavelengths, considering the molar extinction coefficient spectra of oxyhemoglobin (HbO) and deoxyhemoglobin (HbR). Figure 3 (a-c) shows the oxygen saturation maps over time as well as the comparison of percentage change in vessel diameter and hemoglobin oxygen saturation.
Fig 3: Estimation and comparison of percentage change in vessel diameter and hemoglobin oxygen saturation with time for a selected vessel between HAP and LAP. A: Demonstration of drop in vessel diameter for the selected vessels. B: Comparison of the change in vessel diameter for HAP and LAP, C: Corresponding change in hemoglobin oxygen saturation for the same vessel. -
 Finite Element Modeling (FEM) for optimizing LIFU parameters and its guiding process
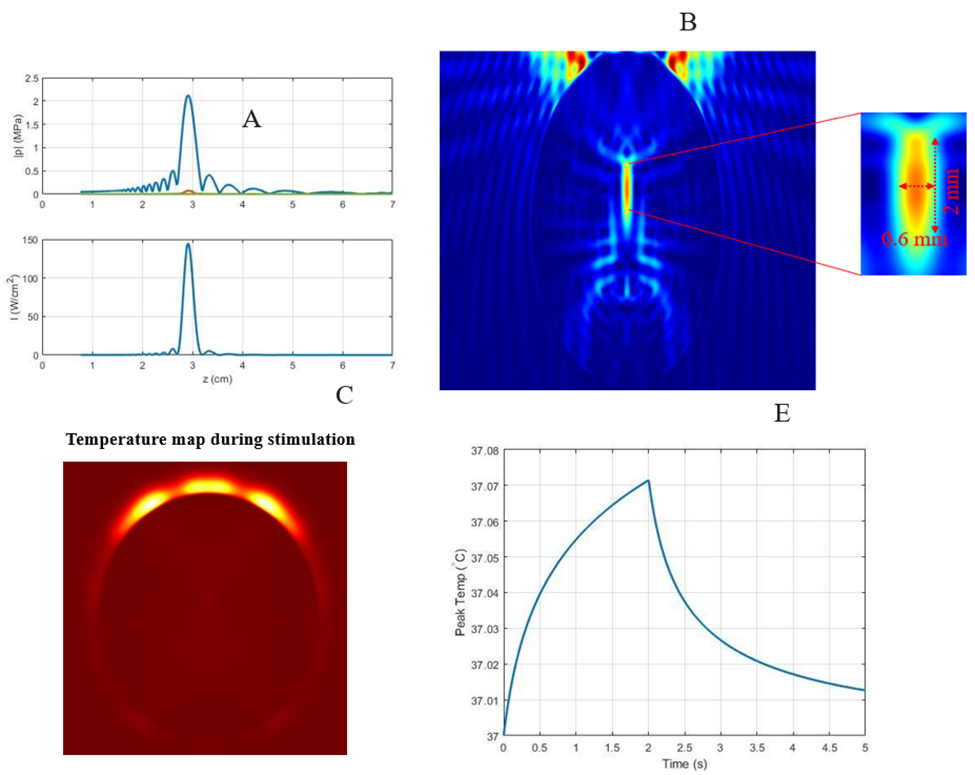
An FEM-based simulation model featuring a focused transducer and a detailed mouse head, including skull and brain tissue, was developed to investigate acoustic signal distribution within an animal brain. This simulation assessed several key parameters:
- the efficiency of LIFU frequencies from 0.5 to 1.3 MHz
- the effects of sound velocity and attenuation in mouse brain tissue on LIFU propagation, and
- how these parameters influence the power density and dimensions of the focal zone.
Fig 4: Distribution of acoustic pressure, intensity, and heat around the focal zone. A. Distribution of axial acoustic pressure and intensity. B. Distribution and Analysis of intensity distribution at focal zone. The lateral beam width at focus is estimated to be 0.6 mm while the axial beam width is 2 mm. C/E Distribution of temperature at focus after 2 s of sonication. Tissue temperature rises by 0.08° C, less than 0.1° C. -
 Low Intensity Focused Ultrasound (LIFU) Stimulation for the Treatment of Alcohol Use Disorder
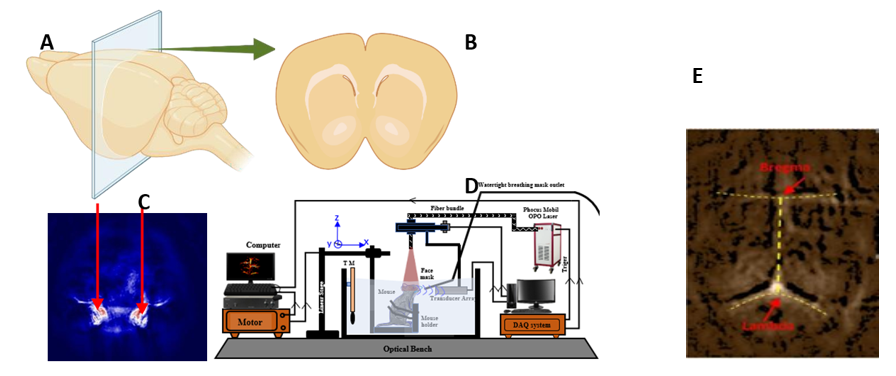
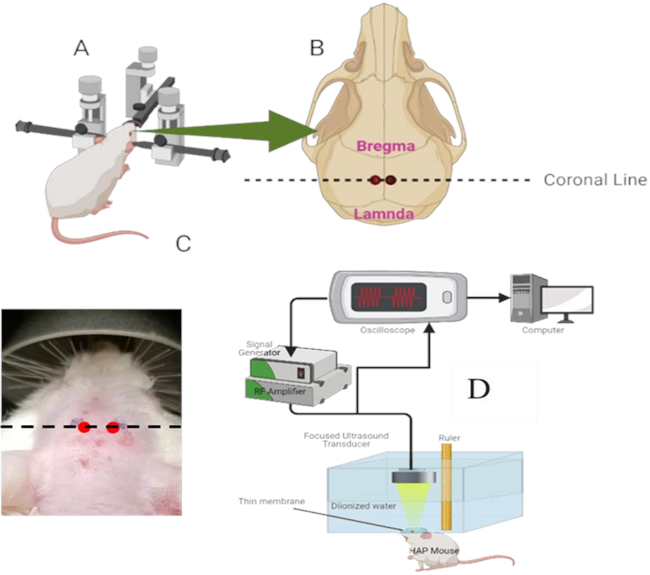
Using a mouse brain atlas, the stereotaxic coordinates of the medial and lateral NAc were marked on the scalp using an indelible marker. A coronal line was then marked across these points to prepare the animal for PAT imaging. A coronal slice of the mouse brain was taken along a plane passing through the marked line to reveal the NAc. Then the PAT image was analyzed to determine the depth of the NAc. This depth was used to adjust the focal length of the LIFU transducer for accurately focusing the ultrasound to the NAc.
Fig 5: Animal preparation for LIFU stimulation. A: Illustration of mouse in stereotaxic frame with B: Mouse scalp showing the bregma and lambda lines. C: Stimulation point for the lateral and medial NAc. D: LIFU stimulation setup. The mouse is wrapped with a custom wrap which restraints and keeps it warm and placed beneath the degassed water tank. A thin plastic membrane is used to cover mouse head as it protrudes beneath the water tank and ultrasound gel used for coupling. -
 Activation of the NAc Following LIFU Stimulation
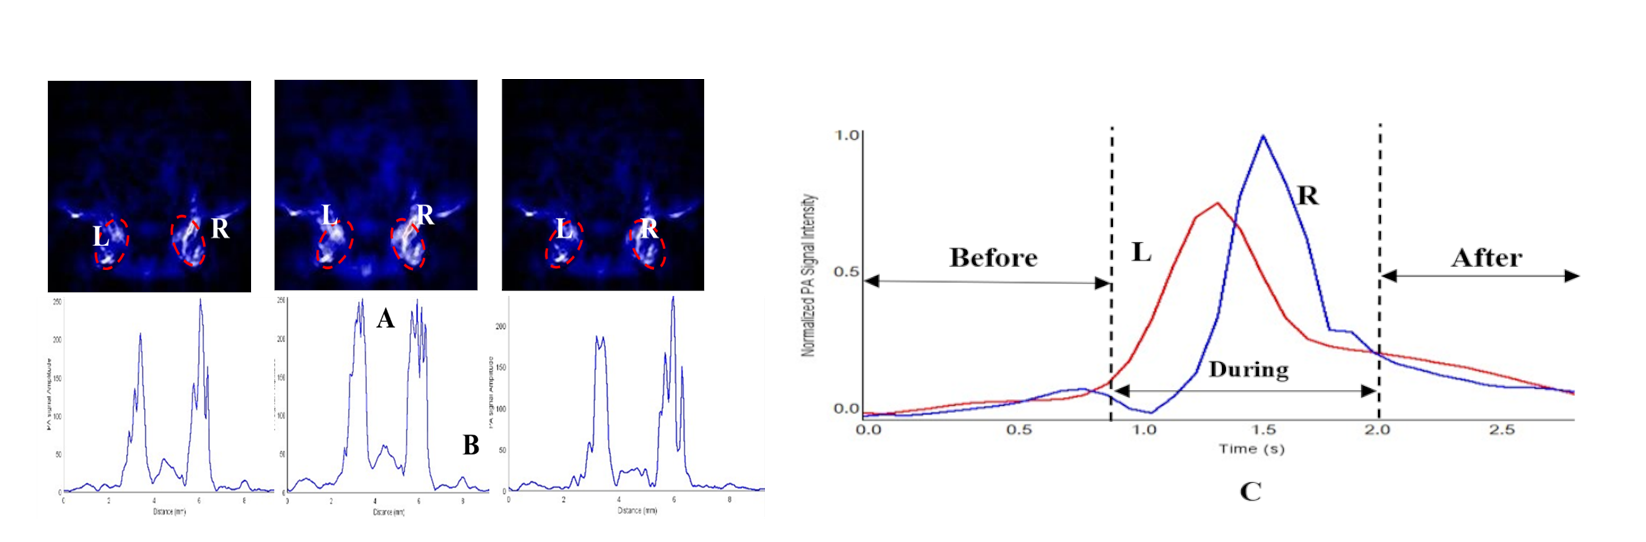
PAT images were acquired for 1s each before, during and after LIFU stimulation, for a total of 3s. and averaged for each second. The signal amplitude across the lateral and medial NAc (for left -L and right-R NAc) shell/core and the change in PAT signal during across each NAc were measured. Through this stimulation process, LIFU affects neuronal excitability of NAc in two ways: by applying mechanical stress that changes the flexibility of cell membranes, and by influencing proteins in the membrane that are sensitive to mechanical forces, which in turn alters the opening and closing of receptor channels. Furthermore, LIFU also activates voltage-gated sodium and calcium channels, leading to the generation of action potentials and the transmission of signals between neurons located at NAc.
Fig 6: Change in PAT signal intensity before, during and after LIFU stimulation. A: PAT functional Images B: Signal Intensity at each NAc. C: Change in PAT signal intensity across each NAC. -
Validation of the UT imaging platforms with phantom experiments
Several phantom experiments were conducted to validate the quantitative capabilities of our UT system. For the phantom, glycerin was used to emulate the sound speed of brain tissue, adjustable from 1500 to 1750 m/s by varying the glycerin concentration, and graphite to mimic tissue sound attenuation, adjustable from 0.3 to 1 dB/cm with varying graphite concentration. The acoustic parameters of these phantoms were cross validated by measuring their physical properties with a 1 MHz unfocused transducer and a needle hydrophone. This involved comparing the literature values and physical acoustic values of the phantoms with the average values from our UT system’s quantitative images, achieving an error margin of less than 6%.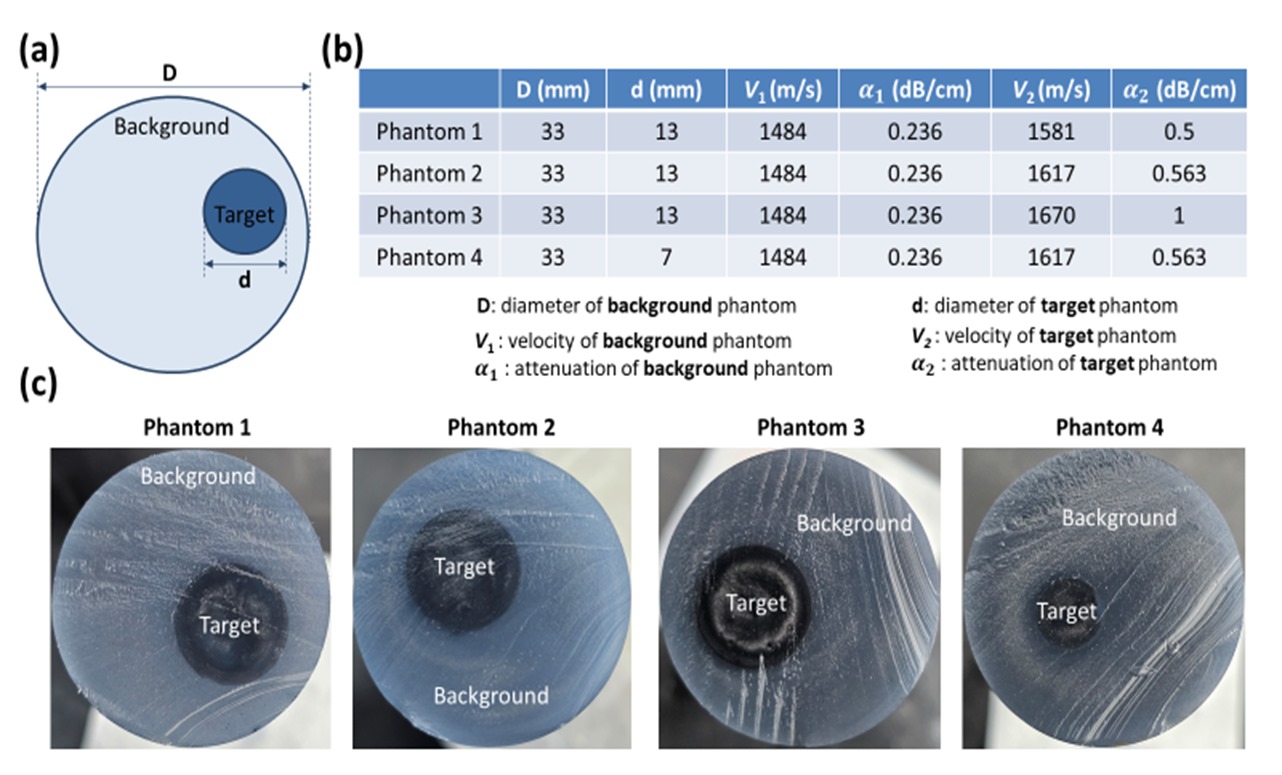
Fig 7A: (a) Schematic of phantom with an internal target. (b) Table depicting the parameters of four phantoms with varying sizes and acoustic properties. (c) Photographs of the four phantoms.
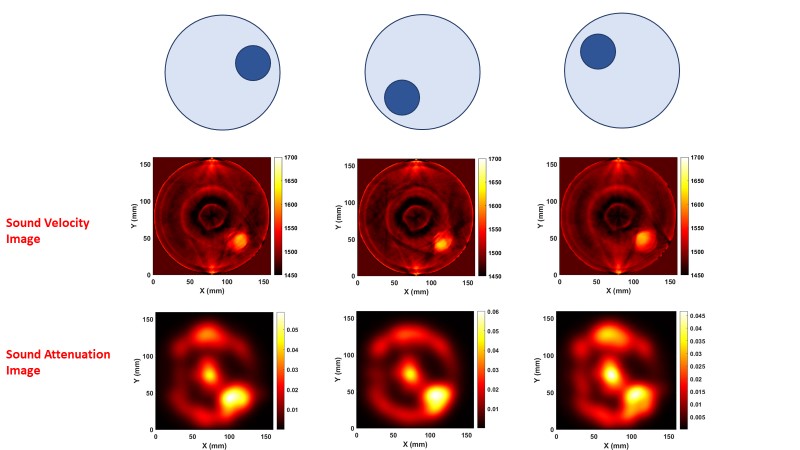
Fig 7B: Reconstructed UT images of acoustic velocity and attenuation.
About Me
Md Iftekhar Islam
PhD Student, Department of Medical Engineering.
University of South Florida
Email: mdiftekhar@usf.edu
Phone: +1 (813) 568 3475
PhD Student, Department of Medical Engineering.
University of South Florida
Email: mdiftekhar@usf.edu
Phone: +1 (813) 568 3475

Research Statement
I am investigating the effectiveness of Low-Intensity Focused Ultrasound (LIFU)
as a Neuromodulation technique to modulate specific brain areas of High Alcohol Preferring (HAP) mice.
This noninvasive modulation process aims to reduce the alcohol dependency behavior of the mice.
To ensure the precise delivery of LIFU, I’m using Ultrasound Tomography (UT) to evaluate the acoustic
distribution, sound speed and attenuation, inside the mouse head.
Additionally, I utilized Photoacoustic Tomography (PAT) to acquire high-resolution functional and
structural images of the mouse brain, providing a precision and comprehensive evaluation of the
neuromodulation effects.
Key Research Interests
Medical Imaging, Photoacoustic Tomography, Ultrasound Tomography, Image-Guided Therapy, Neuromodulation.Publications
Deep Learning in Lung and Colon Cancer Classifications
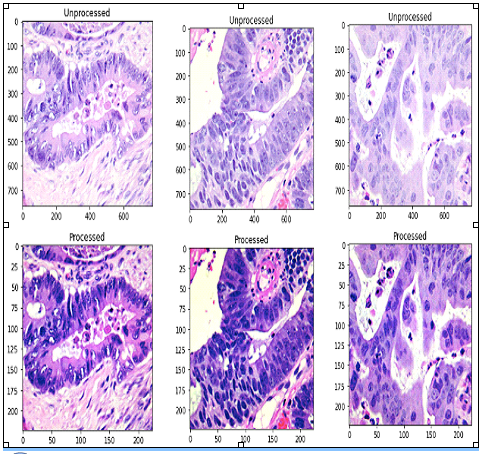
Krishna Mridha, MD. Iftekhar Islam, Shamin Ashfaq, Masrur Ahsan Priyok, Dipayan Barua.
Paper Link
An AI-based framework to classify and differentiate five types of colon and lung cancer cells. The framework uses Digital Image processing (DIP) and Deep Learning (DL) algorithms to process and evaluate histopathological images of cancer cells.
Paper Link
DBNet: Detect Diabetic Retinopathy to Stop Blindness Before It’s Too Late
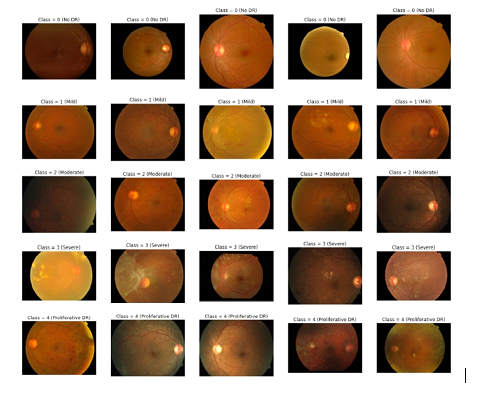
Krishna Mridha, Meghla Monir Shorna, Nazmul Arefin, Ananya Ritu, MD Minhazul Alam Chowdhury, MD. Iftekhar Islam
Paper Link
A hybrid autoencoder framework that combines Convolutional Neural Networks (CNN) and Long-Short Term Memory (LSTM) to enhance the accuracy of adaptive retinopathy prediction from fundus images of the retina.
Paper Link
ML-DP: A Smart Emotion Detection System for Disabled Person to Develop a Smart City
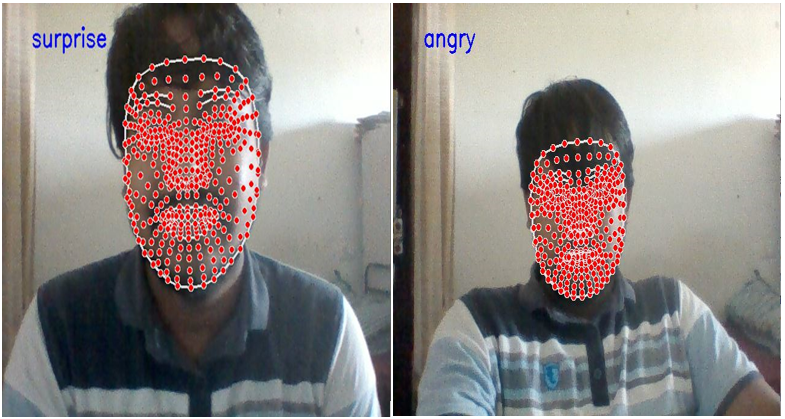
Krishna Mridha, MD. Iftekhar Islam, Meghla Monir Shorna, Masrur Ahsan Priyok.
Paper Link
A smart emotion recognition system that uses a convolutional neural network to analyze the facial landmarks of impaired people to comprehend their emotional state. The system is also able to inform the caregiver in case of a sudden breakdown of emotions of the impaired individual.
Paper Link
An indoor navigation system for visually impaired people using a pathfinding algorithm and a wearable cap

MD. Iftekhar Islam, MD. Forhadur Rahman, MD. Maruf Hossain Raj, Sabbir Hossen, Shantanu Nath, Dr. Mohammad Hasan Imam
Paper Link
The indoor-based navigation system, specially designed for visually impaired people, consists of two modules: a cap designed with IR receivers and sensors, and the architecture of the area where the navigation system works by guiding the user.
Paper Link
Bioactivity classification of SARS-CoV-2 Proteinase using Machine Learning Approaches
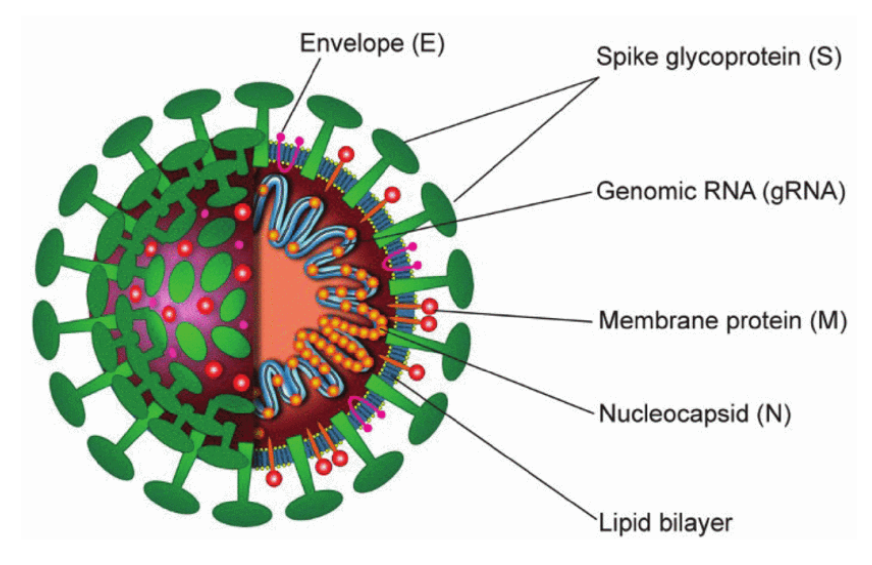
Fatema Begum, Krishna Mridha, Md Golam Rabbani, Shamin Ashfaq, MD. Iftekhar Islam, Sapna Sinha
Paper Link
A novel classifier model that forecasts Bioactivity of SARS-CoV-2 Proteinase more accurately than other existing models. The model uses a variety of classification techniques, including the SVM, Random Forest, LR, KNN, and Naive Bayes. The major goal of applying the parametric technique is to improve the performance of a well-known SARS-CoV-2 single proteins dataset derived from the well-known “ChEMBL” database.
Paper Link
Software and Programming Skills
- COMSOL Multiphysics
- MATLAB & Simulink
- SOLIDWORKS
- Python Programming
- Machine Learning
Professional Experience
- PhD Student, University of South Florida (August 2023 - Present)
- IELTS Instructor, London Educators (April 2023 – August 2023)
- Research Assistant, Research Hub Inc. (January 2022 - August 2023)
- Medical Physicist, NINMAS (January 2020 – November 2020)